


General Dashboard
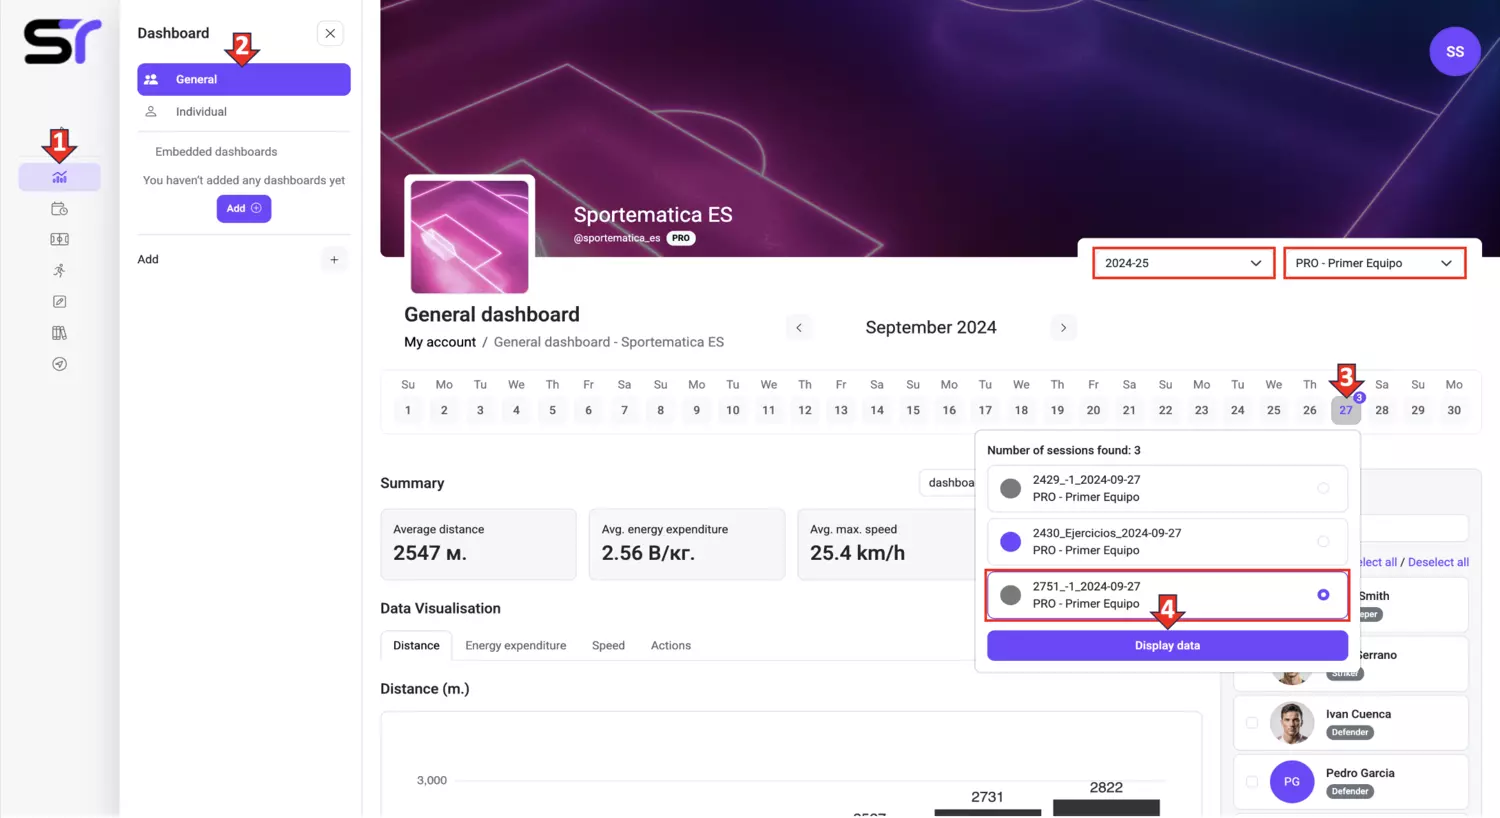
The key tools for training analysis are dashboards. The Sportematica platform offers two built-in options: general and individual, as well as the possibility of adding external dashboards. To analyze team actions, follow these steps (see screenshot below):
1. Click on the Dashboard icon in the side menu.
2. Select the General option.
3. Specify the desired season and team.
4. In the calendar, find the required training date and click on it.
5. Select the training session.
6. Click on the Show Data button.
After loading the data in the general dashboard, you will have access to:
1. Viewing data for all exercises or individually.
2. Filtering data by all team players or only selected ones.
3. Key indicators located above the main graphs.
4. The visualizations themselves, divided into 4 tabs:
- Distance: total and segmented coverage of space.
- Energy expenditure: metabolic load of players.
- Speed: data on average, maximum speed, and intensity zones.
- Actions: analysis of accelerations, decelerations, and other key activities.
5. The ability to add your own visualizations based on a wide range of metrics.
Great! You have mastered working with the General dashboard. Now let's move on to the Individual dashboard to analyze the performance of each player in detail.